Visual Review Analytics
TL;DR
Problem
Manual review processes were time-consuming, prone to errors, and lacked visual insights, hindering stakeholders' ability to make informed decisions.
Approach
Conducted competitive analysis to explore existing sentiment analysis platforms for UX and feature inspiration.
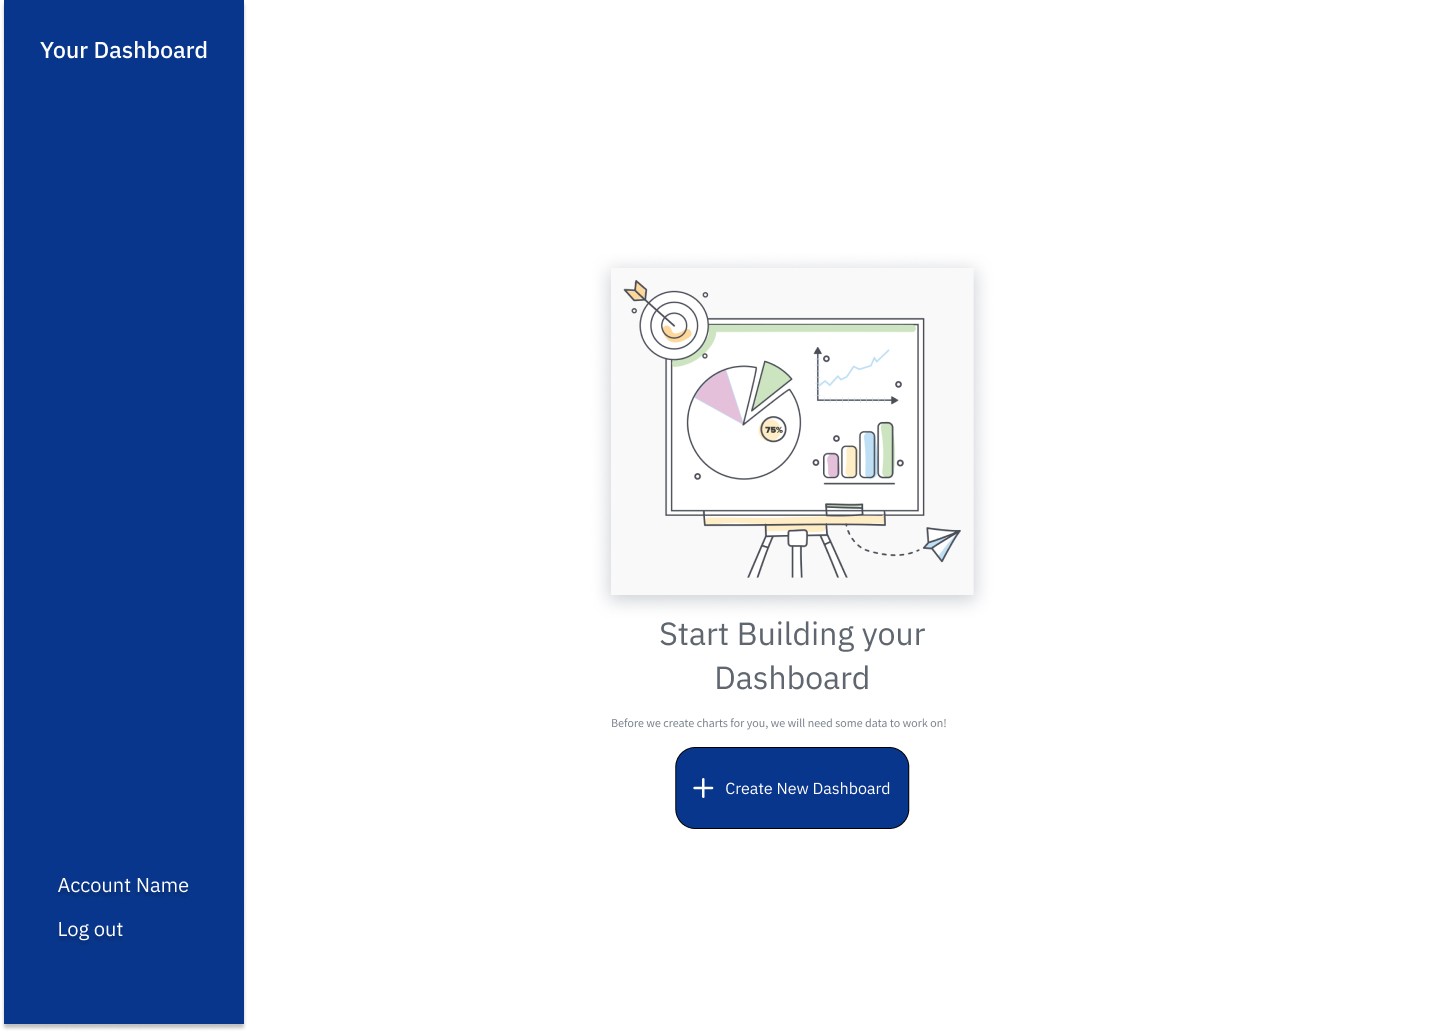
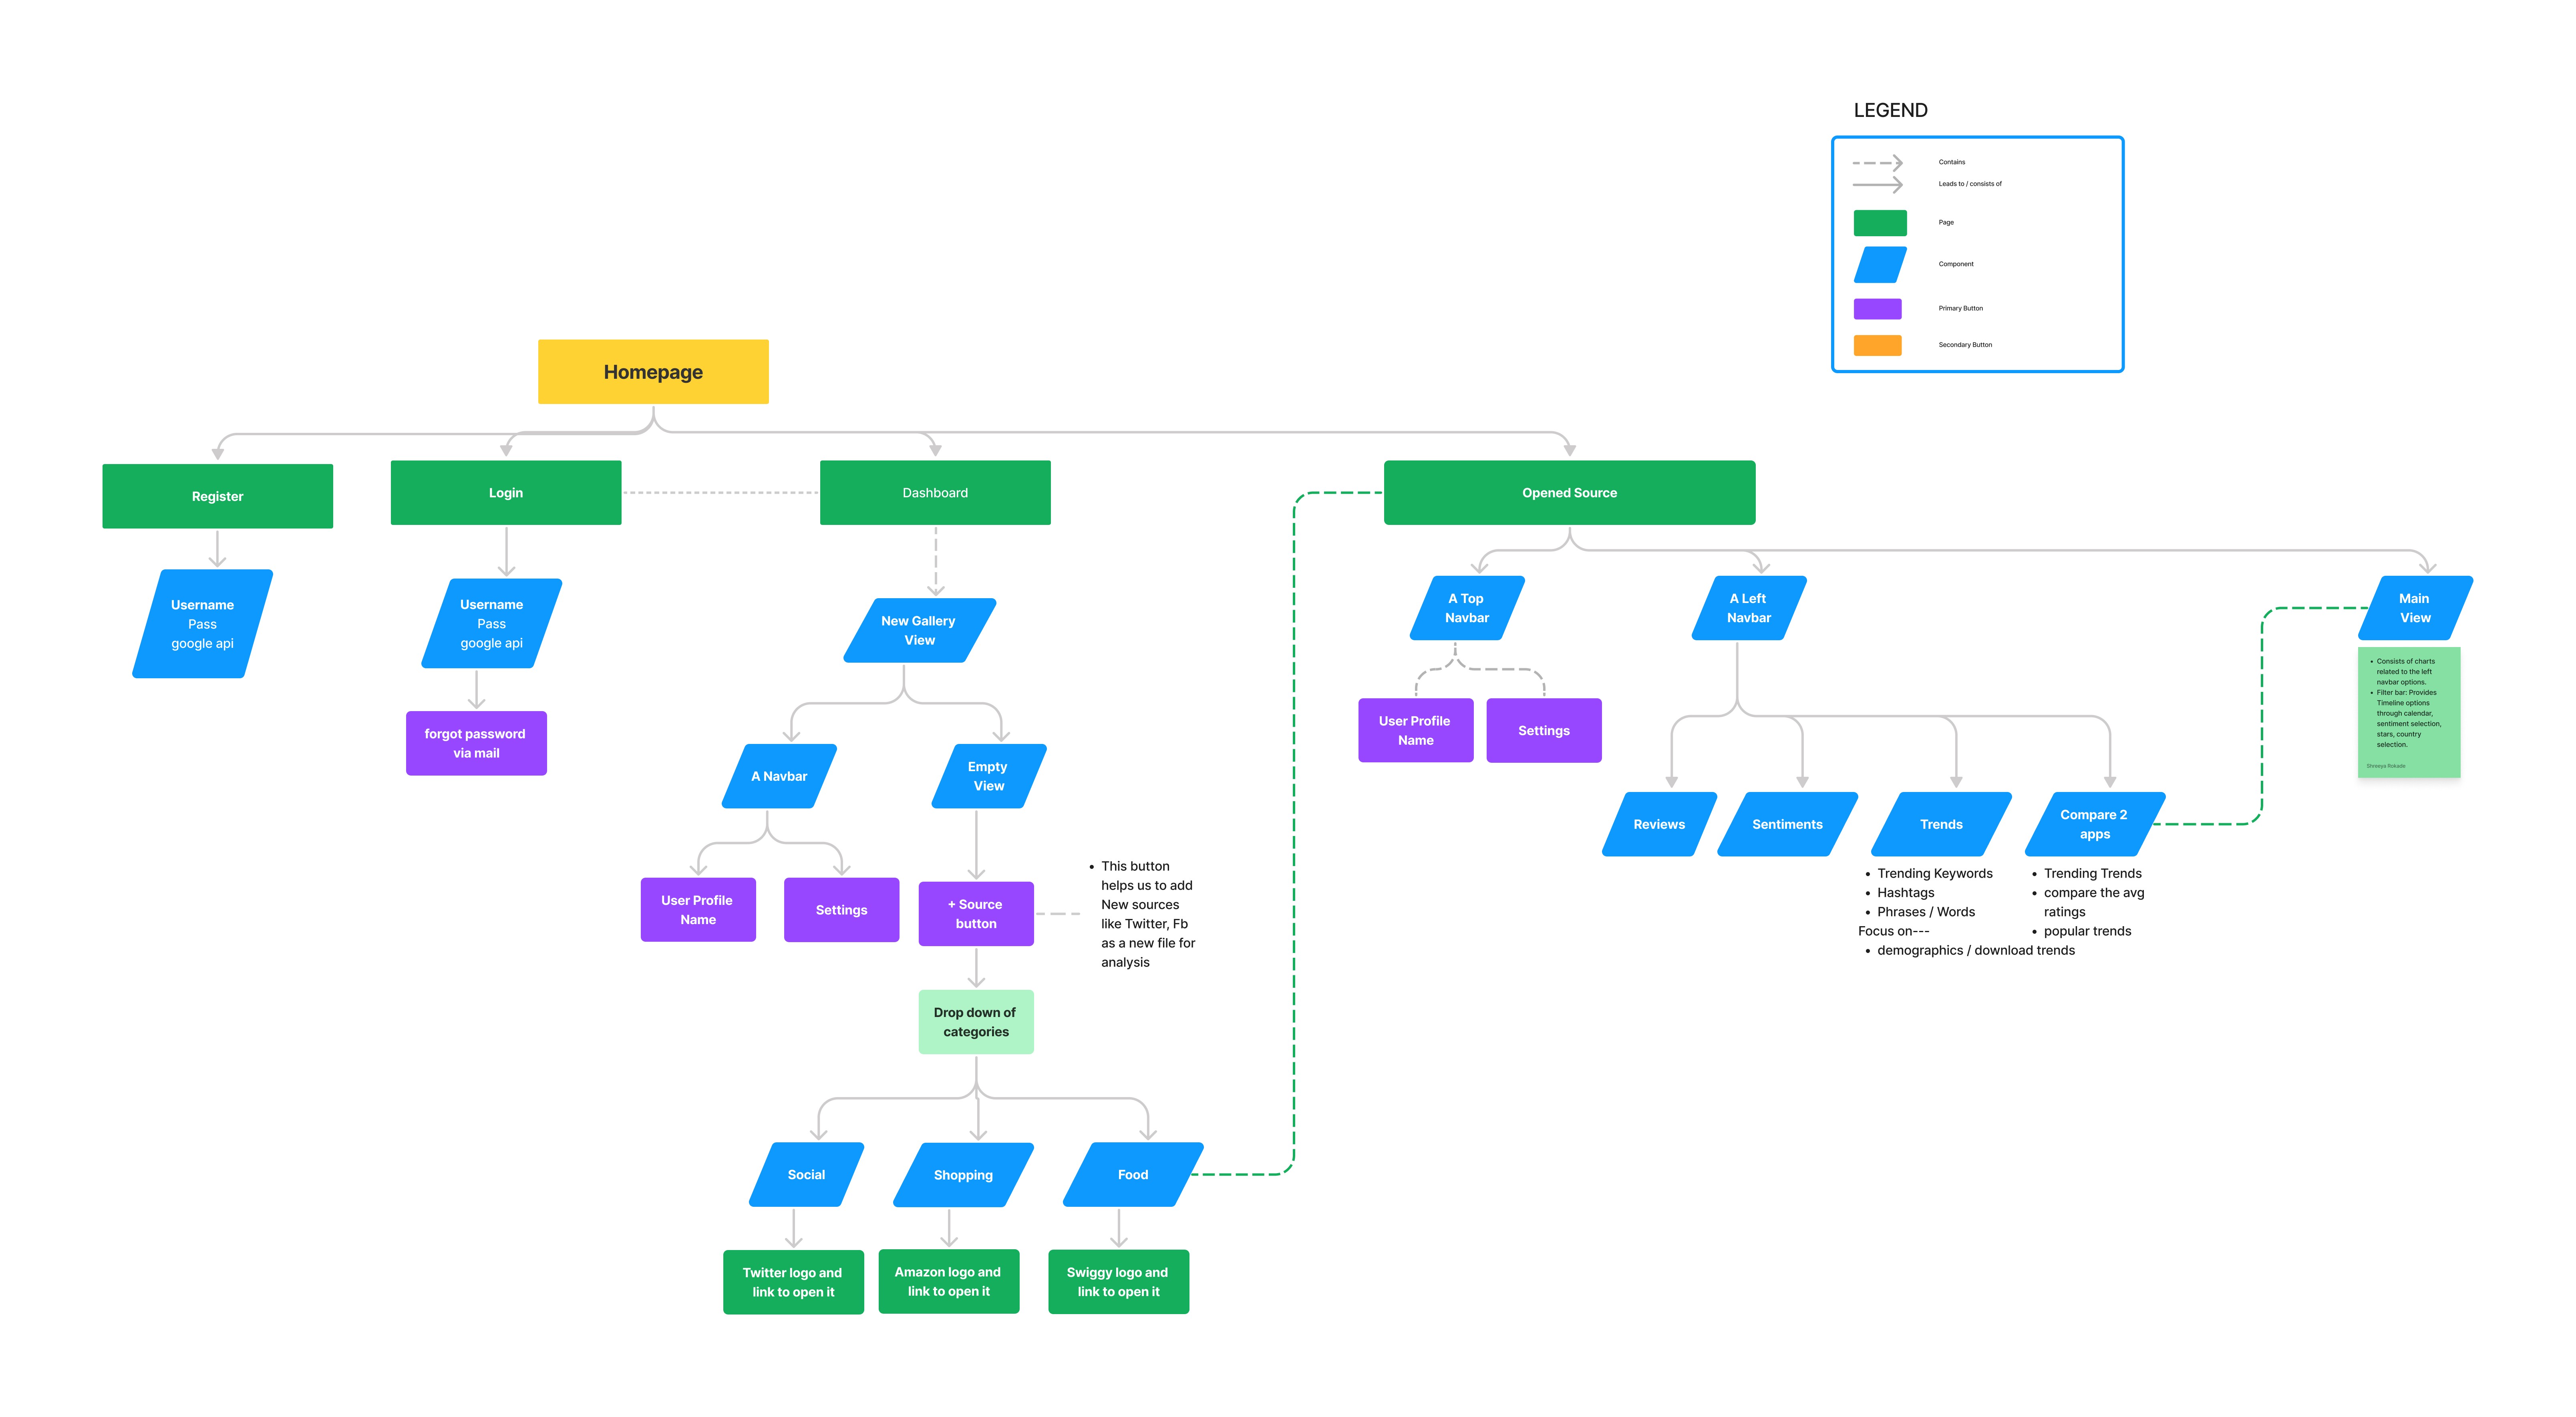
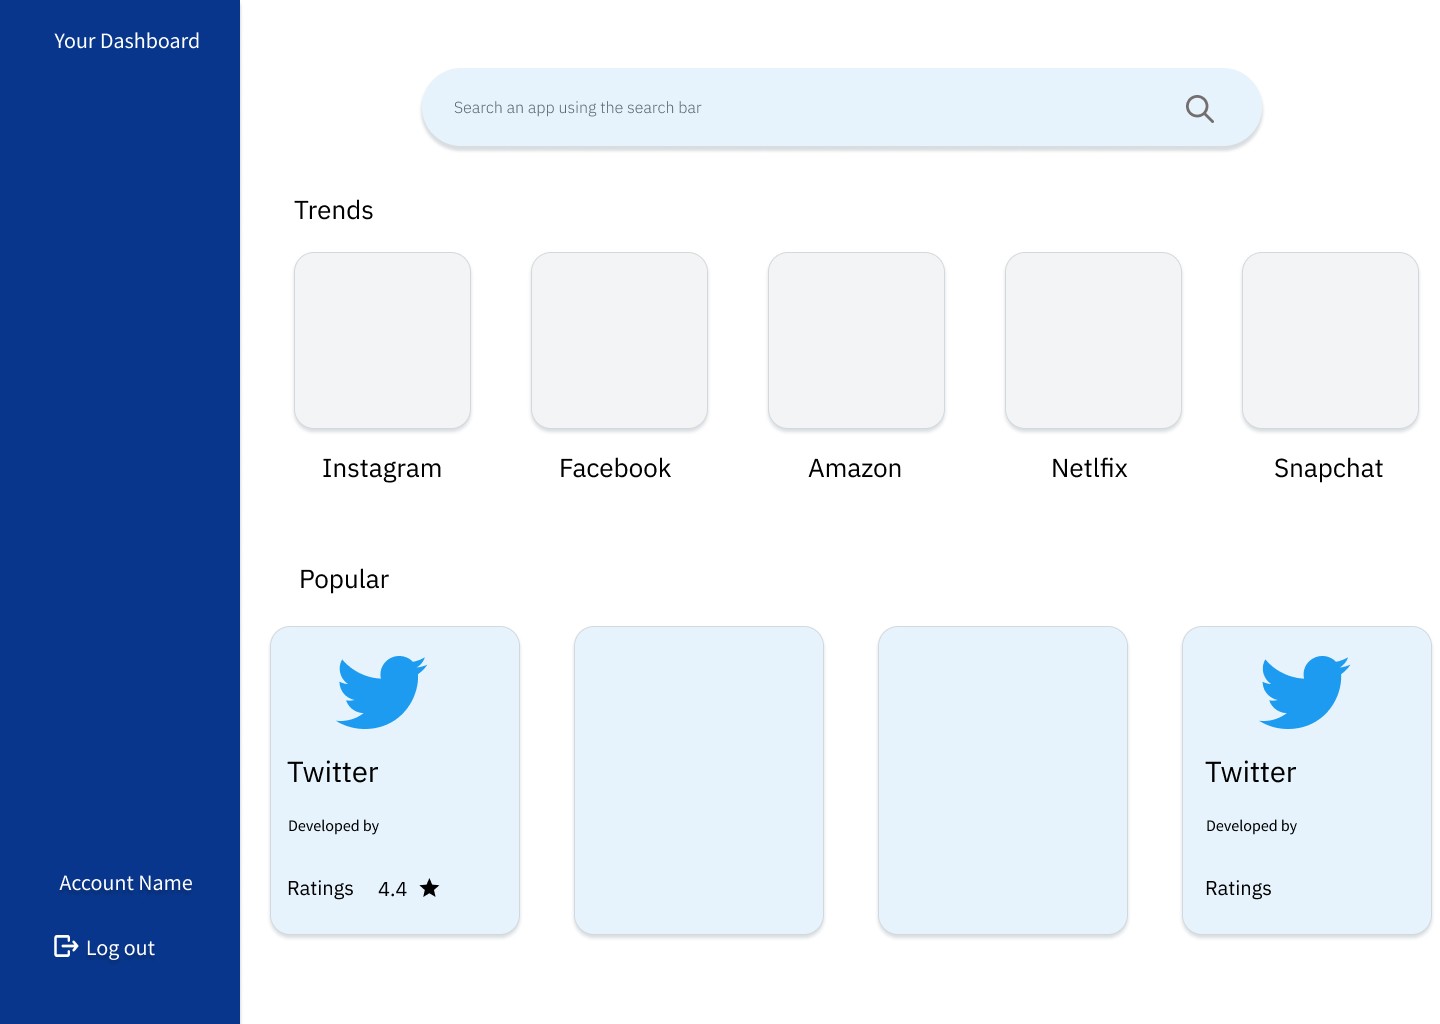
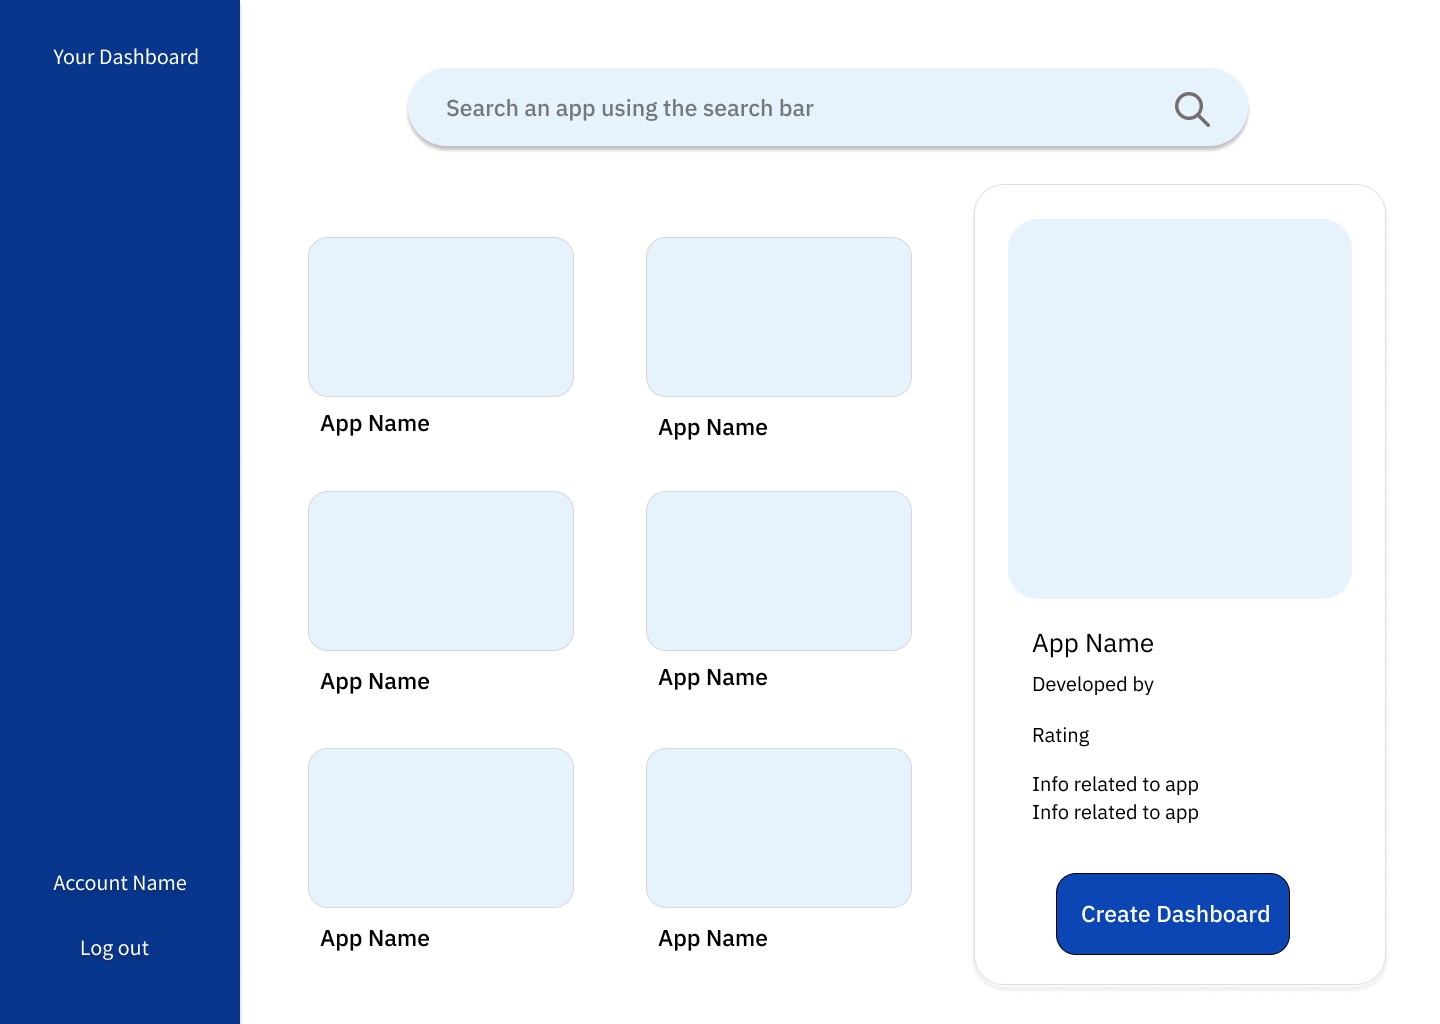
Designed intuitive wireframes for a data-centric interface using user feedback as a guide.
Developed the front-end with React.js and Chart.js, integrating NLP libraries for automated sentiment analysis.
Outcome
Delivered a dynamic sentiment analysis tool that visualized insights in real-time, improving decision-making efficiency and workflow for business stakeholders.
Overview
The Visual Review Analytics (VRA) tool was developed as a final-year project to tackle inefficiencies in manual sentiment analysis processes. The objective was to automate feedback analysis, present data-driven insights visually, and simplify stakeholder decision-making. As the lead front-end developer, I utilized React.js, Chart.js, Material-UI components, and NLP libraries to build a responsive, interactive UI aligned with industry standards.
Key contributions
Conducted user research through informal conversations to identify usability pain points and prioritize user needs.
Designed and developed a responsive interface with clear data visualization and improved navigation.
Ensured seamless collaboration with backend developers to deliver scalable, user-friendly solutions.
Role
Lead Front-End Developer
Duration
Fall 2023 (4 Agile Sprints)
Tools

Figma

VS Code

React js

Material UI
Problem Statement
Manual review analysis was labor-intensive, error-prone, and lacked visual clarity, making it challenging for stakeholders to extract actionable insights. The project aimed to create an automated solution that could process user feedback efficiently and visually present sentiment trends.
My Approach
Key Steps:
Competitive Analysis
Studied platforms like Appbot and Mixpanel to analyze sentiment analysis flows, extracting actionable UI/UX insights.Wireframing & Prototyping
Designed wireframes for a clean, interactive interface, emphasizing data clarity and accessibility through interactive charts.Front-End Development
Built a responsive, modular UI using React.js, Chart.js, and Material-UI components, ensuring a cohesive and accessible user experience.NLP Integration
Leveraged natural language processing libraries to categorize user feedback, enabling immediate sentiment insights.
Key results obtained
Delivered real-time, visualized insights that improved decision-making efficiency for stakeholders.
Created an intuitive interface that increased user engagement with data presentation tools.
Solution
Wireframes & Sketches


